What Is a Height Percentile?
A height percentile is a statistical reference comparison that describes where an individual's measured height falls relative to a benchmark population of the exact same age and biological sex. Using standardized data collected from large-scale population surveys, height percentile calculations allow parents, individuals, and health researchers to understand growth patterns in context.
When evaluated using our height percentile calculator, the percentile score represents the percentage of individuals in the reference population who measure equal to or shorter than the entered height. For instance, a child whose height falls at the 75th percentile for age and sex is taller than approximately 75% of peers in the reference population, while 25% are taller.
Key statistical principles of height percentiles include:
- The 50th Percentile is the Median: The exact midpoint where half the reference population is taller and half is shorter.
- Height-for-Age Evaluation: Human growth is strongly age-dependent; thus, height measurements must always be compared against age-matched reference cohorts.
- Biological Sex Standardization: Males and females follow distinct biological growth trajectories, requiring sex-specific reference parameters.
- Comparative Range: Percentiles offer a relative height comparison rather than a qualitative rating or clinical health score.
How Does the Height Percentile Calculator Work?
The height percentile calculator by age and sex processes input data through an 8-step statistical pipeline to deliver accurate, reference-matched output without manual lookup tables:
- Age Input Processing: The user enters age in years and months, which is precise to total decimal months.
- Sex Selection: The user selects biological male or female to pick the corresponding reference parameter set.
- Height Input & Conversion: Height entered in centimeters or feet/inches is standardized into total centimeters (1 in = 2.54 cm).
- Dataset Matching: Age in total months is evaluated against the WHO Child Growth Standards (0 to 24 months) or CDC Growth Charts (24 to 240 months).
- LMS Parameter Lookup: L (skewness), M (median), and S (coefficient of variation) parameters are retrieved or linearly interpolated for exact age.
- Z-Score Calculation: Standardized statistical deviation (Z-score) is calculated using the mathematical LMS formula.
- Percentile Conversion: The Z-score is mapped to a cumulative probability distribution function (CDF) to determine the exact percentile rank.
- Result Interpretation Display: The percentile, category, median comparison, and visual position scale are rendered.
Different growth references (e.g., WHO vs. CDC) utilize different sample populations, which is why standard selection is clearly displayed alongside every result.
2. Select dataset = WHO (0-24 months) or CDC (24-240 months) for biological sex
3. Interpolate L, M, S parameters for exact age in months
4. Compute Z-score: Z = (((X / M)^L) - 1) / (L × S)
5. Compute cumulative percentile = NormalCDF(Z) × 100
The standard normal cumulative distribution function (CDF) is computed using the Abramowitz and Stegun error function approximation, ensuring floating-point precision across all age inputs.
How to Calculate Height Percentile
A true height percentile calculation requires statistical reference data rather than a simple mathematical ratio. A common misconception is that a percentile can be found using:
This simple ratio does NOT produce a statistical percentile because human growth distribution is non-linear and exhibits natural skewness across different age ranges. Correct calculation requires the LMS Method developed by Cole & Green, which models skewness (L), median (M), and variation (S).
When L = 0: Z = ln(X / M) / S
Where the variables represent:
- X: Measured height in centimeters.
- L: Box-Cox transformation power parameter (skewness adjustment).
- M: Population median height in centimeters (50th percentile).
- S: Coefficient of variation (scale factor reflecting population spread).
Once the Z-score is computed, it is transformed into a cumulative distribution function value (CDF(Z)) representing the exact cumulative height percentile.
Height Percentile by Age
Because child height percentile progression changes rapidly throughout childhood and adolescence, height measurements must always be evaluated in relation to exact age. A height percentile for a 2-year-old child cannot be evaluated using reference data meant for a 5-year-old or 10-year-old.
Our calculator seamlessly manages age-based reference selection across all developmental stages:
| Developmental Stage | Age Range | Primary Growth Reference Standard | Growth Characteristics |
|---|---|---|---|
| Infants & Toddlers | 0 to 24 months (0–2 yrs) | WHO Child Growth Standards | Rapid recumbent length growth (~25 cm in year 1) |
| Preschool Children | 2 to 5 years (24–60 mos) | CDC 2000 Growth Charts | Steady standing height velocity (~6–8 cm/yr) |
| School-Age Children | 5 to 11 years (60–132 mos) | CDC 2000 Growth Charts | Consistent linear growth prior to pubertal onset |
| Adolescents & Teens | 12 to 20 years (144–240 mos) | CDC 2000 Growth Charts | Pubertal growth spurt, epiphyseal plate closure |
Users searching for specific age references—such as a height percentile for a 2 year old, 5 year old, 10 year old, 12 year old, 15 year old, or 17 year old—can select exact years and months in the calculator above to generate immediate, accurate output.

Child Height Percentile
Tracking a child height percentile helps parents and pediatricians monitor physical growth milestones against established population references. Growth charts are routinely checked during well-child visits to ensure steady development along a consistent percentile curve.
Important factors when tracking child growth percentiles include:
- Biological Sex Differences: Boys and girls follow different average growth trajectories.
- Measurement Precision: Small errors in height measurements can alter calculated percentiles by several points.
- Growth Trajectory Consistency: Remaining around the same percentile curve (e.g., staying near the 40th or 70th percentile) is typically more informative than the absolute number itself.

For detailed child-focused analysis and tracking tools, visit our specialized Child Height Percentile Calculator page.
Boys Height Percentile
Evaluating a boys height percentile requires matching measured stature against verified male growth references. Male growth curves reflect specific developmental timing, including a later and typically longer pubertal growth spurt compared to girls.

Key aspects of boys' height progression:
- Infant Median Stature: At birth, median male length is approximately 49.9 cm (19.6 in).
- 5-Year-Old Median: At age 5 (60 months), median male height is 112.7 cm (44.4 in).
- 10-Year-Old Median: At age 10 (120 months), median male height is 142.5 cm (56.1 in).
- 15-Year-Old Median: At age 15 (180 months), median male height reaches 172.8 cm (68.0 in).
To view comprehensive reference percentile tables for males across all ages, visit our dedicated Boys Height Chart and our complete Height Percentile Chart.
Girls Height Percentile
Evaluating a girls height percentile utilizes sex-specific female reference tables. Female growth acceleration typically begins earlier in childhood than in males, usually accompanying early pubertal stages before leveling off as adult stature is attained.
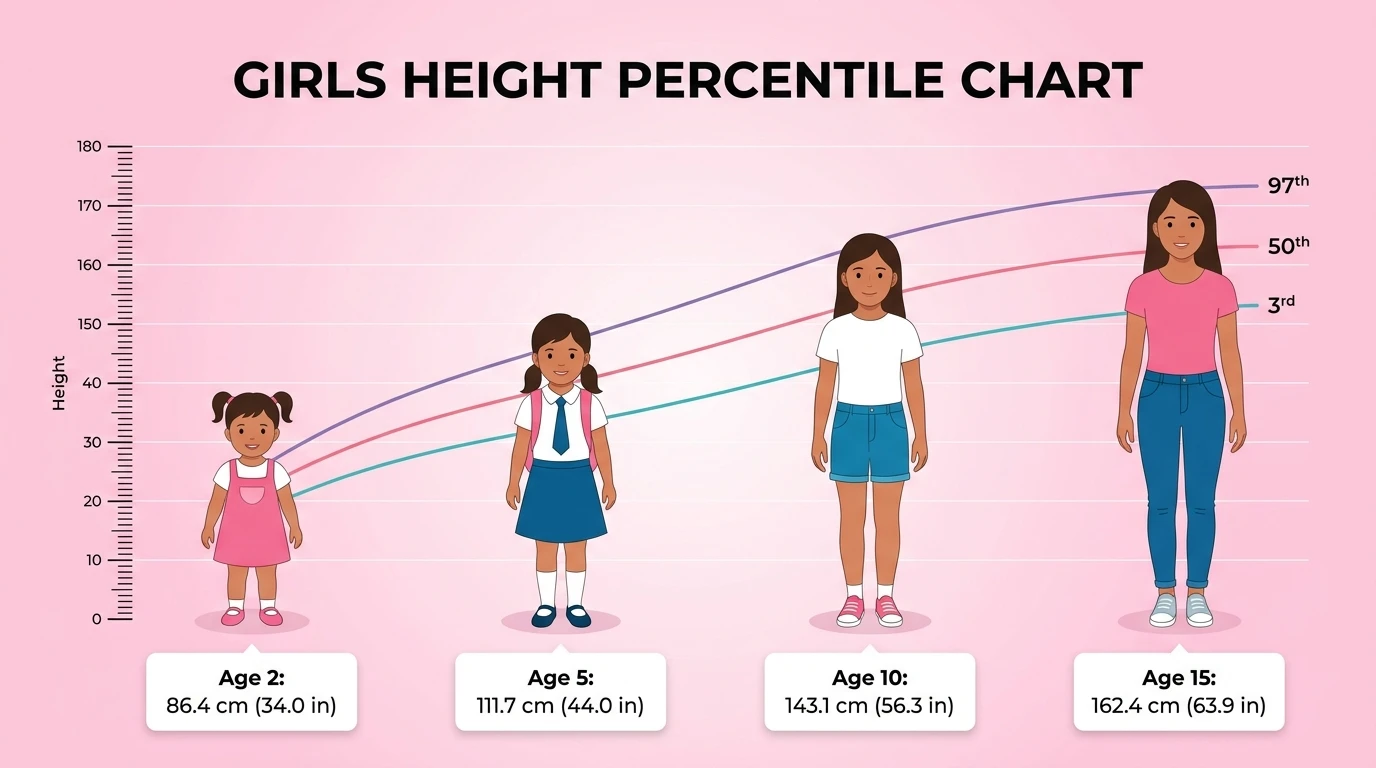
Key benchmarks in female height progression:
- Infant Median Stature: At birth, median female length is approximately 49.2 cm (19.4 in).
- 5-Year-Old Median: At age 5 (60 months), median female height is 111.7 cm (44.0 in).
- 10-Year-Old Median: At age 10 (120 months), median female height is 143.1 cm (56.3 in).
- 15-Year-Old Median: At age 15 (180 months), median female height reaches 162.4 cm (63.9 in).
To explore female-specific growth curves, visit our specialized Girls Height Chart.
Height Percentiles for Children and Teens
Growth throughout childhood and adolescence is dynamic and non-linear. During puberty, individual variations in pubertal timing (early, average, or late maturers) can temporarily shift a teenager's height percentile up or down relative to age peers.
Considerations for teen height percentiles:
- Growth Timing Variance: An early-maturing teen may temporarily jump to a higher percentile, while a late-maturing teen may temporarily drop percentile rank before their growth spurt occurs.
- Longitudinal Observation: A single measurement during adolescence is less informative than observing a multi-year growth trajectory.
- Epiphyseal Closure: Linear growth gradually slows and stops following epiphyseal plate fusion in late adolescence.
Height Percentile Chart
Below is a verified summary preview of age-specific height percentile values derived directly from our official WHO and CDC datasets. Both our interactive calculator and reference tables share this exact single source of data truth.
| Age | Sex | 3rd % | 10th % | 25th % | 50th % (Median) | 75th % | 90th % | 97th % |
|---|---|---|---|---|---|---|---|---|
| 2 Years | Male | 81.7 cm | 83.7 cm | 86.0 cm | 88.8 cm | 91.6 cm | 93.9 cm | 95.9 cm |
| 2 Years | Female | 79.5 cm | 81.5 cm | 83.7 cm | 86.4 cm | 89.1 cm | 91.3 cm | 93.3 cm |
| 5 Years | Male | 101.4 cm | 104.5 cm | 108.2 cm | 112.7 cm | 117.2 cm | 120.9 cm | 124.0 cm |
| 5 Years | Female | 99.8 cm | 103.1 cm | 107.0 cm | 111.7 cm | 116.4 cm | 120.3 cm | 123.6 cm |
| 10 Years | Male | 129.7 cm | 133.8 cm | 137.9 cm | 142.5 cm | 147.0 cm | 151.1 cm | 155.1 cm |
| 10 Years | Female | 129.4 cm | 133.7 cm | 138.1 cm | 143.1 cm | 148.0 cm | 152.3 cm | 156.5 cm |
| 15 Years | Male | 155.6 cm | 161.1 cm | 166.7 cm | 172.8 cm | 178.8 cm | 184.2 cm | 189.6 cm |
| 15 Years | Female | 148.7 cm | 153.2 cm | 157.5 cm | 162.4 cm | 171.6 cm | 176.0 cm | 176.0 cm |
Average Height by Age
The term "average height" typically refers to the 50th percentile median height of a population. While "average" in common language refers to the arithmetic mean, growth references use the median to represent central tendency because human stature distributions can exhibit mild skewness.
| Age Milestone | Boys Median Height (50th %) | Girls Median Height (50th %) | Reference Dataset Source |
|---|---|---|---|
| Birth (0 Months) | 49.9 cm (19.6 in) | 49.2 cm (19.4 in) | WHO Child Growth Standards |
| 1 Year (12 Months) | 76.5 cm (30.1 in) | 74.0 cm (29.1 in) | WHO Child Growth Standards |
| 2 Years (24 Months) | 88.8 cm (35.0 in) | 86.4 cm (34.0 in) | CDC 2000 Growth Charts |
| 5 Years (60 Months) | 112.7 cm (44.4 in) | 111.7 cm (44.0 in) | CDC 2000 Growth Charts |
| 10 Years (120 Months) | 142.5 cm (56.1 in) | 143.1 cm (56.3 in) | CDC 2000 Growth Charts |
| 12 Years (144 Months) | 155.3 cm (61.1 in) | 155.2 cm (61.1 in) | CDC 2000 Growth Charts |
| 15 Years (180 Months) | 172.8 cm (68.0 in) | 162.4 cm (63.9 in) | CDC 2000 Growth Charts |
| 18 Years (216 Months) | 176.7 cm (69.6 in) | 163.2 cm (64.3 in) | CDC 2000 Growth Charts |
| 20 Years (240 Months) | 176.8 cm (69.6 in) | 163.3 cm (64.3 in) | CDC 2000 Growth Charts |
Understanding Height Percentile Ranges
Height percentile ranges describe statistical positioning across population distributions. It is vital to interpret percentile ranges without assigning arbitrary clinical labels such as "healthy" or "unhealthy".
| Percentile Band | General Statistical Interpretation | Population Relationship |
|---|---|---|
| Below 3rd Percentile | Lower statistical boundary of population reference | Shorter than ~97% of age- and sex-matched peers |
| 3rd – 10th Percentile | Lower relative position within reference range | Shorter than ~90% of age- and sex-matched peers |
| 10th – 25th Percentile | Lower-intermediate relative position | Shorter than 50% to 90% of reference peers |
| 25th – 75th Percentile | Central reference distribution band | Surrounds the 50th percentile median height |
| 75th – 90th Percentile | Higher-intermediate relative position | Taller than 75% to 90% of reference peers |
| 90th – 97th Percentile | Higher relative position within reference range | Taller than ~90% of age- and sex-matched peers |
| Above 97th Percentile | Upper statistical boundary of population reference | Taller than ~97% of age- and sex-matched peers |
Height Percentile vs. Average Height
The distinction between average height and a height percentile is a common point of statistical confusion:
- Average / Median Height: A fixed central tendency value (the 50th percentile) representing the population midpoint for a specific age and sex.
- Height Percentile: A personal comparative rank indicating where an individual's specific height sits across the entire bell-curve distribution.
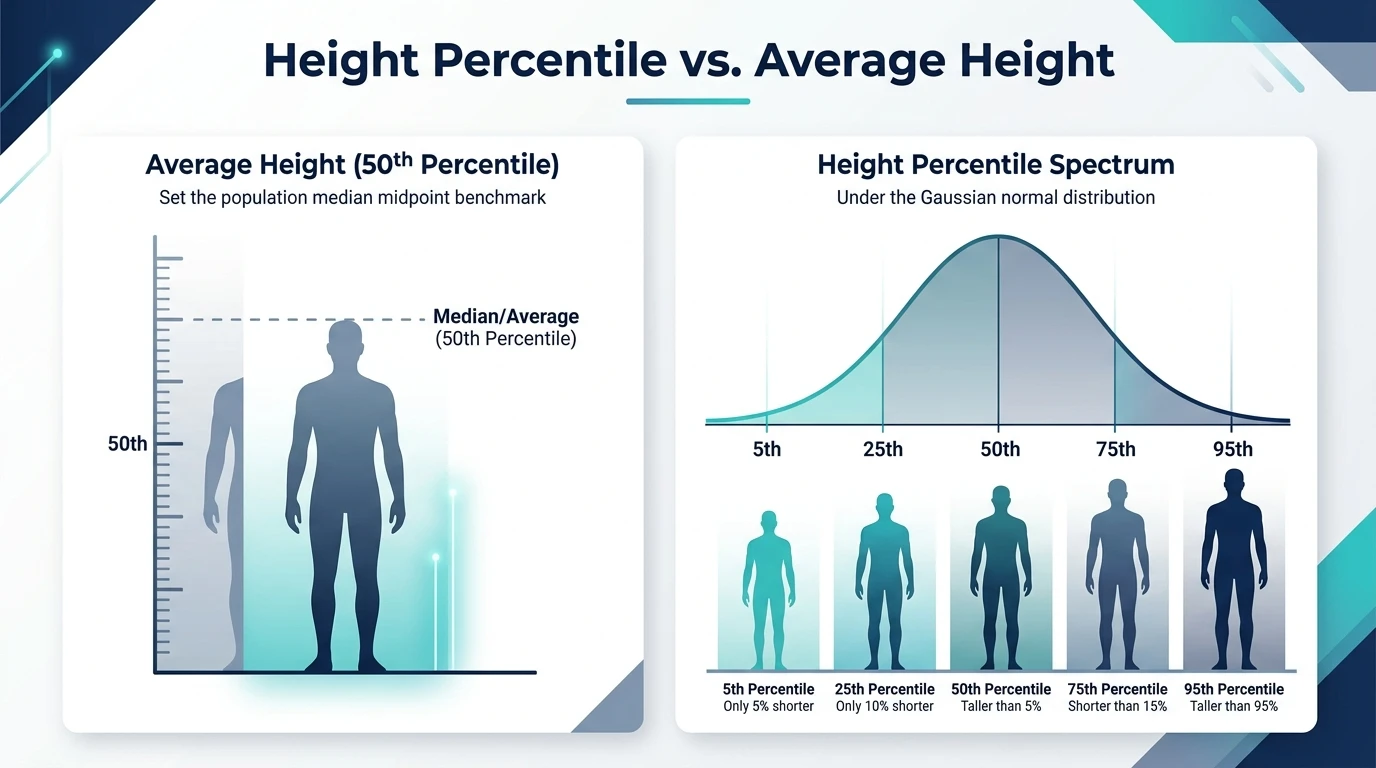
An individual can be significantly shorter or taller than the population median (average) without that variation indicating any underlying health issue. Human stature naturally varies due to genetics, nutrition, and environmental factors.
Why Growth Over Time Matters
A single height percentile reading is simply a point-in-time measurement. In pediatric care, observing growth over time provides far greater insight than any single calculated percentile value.
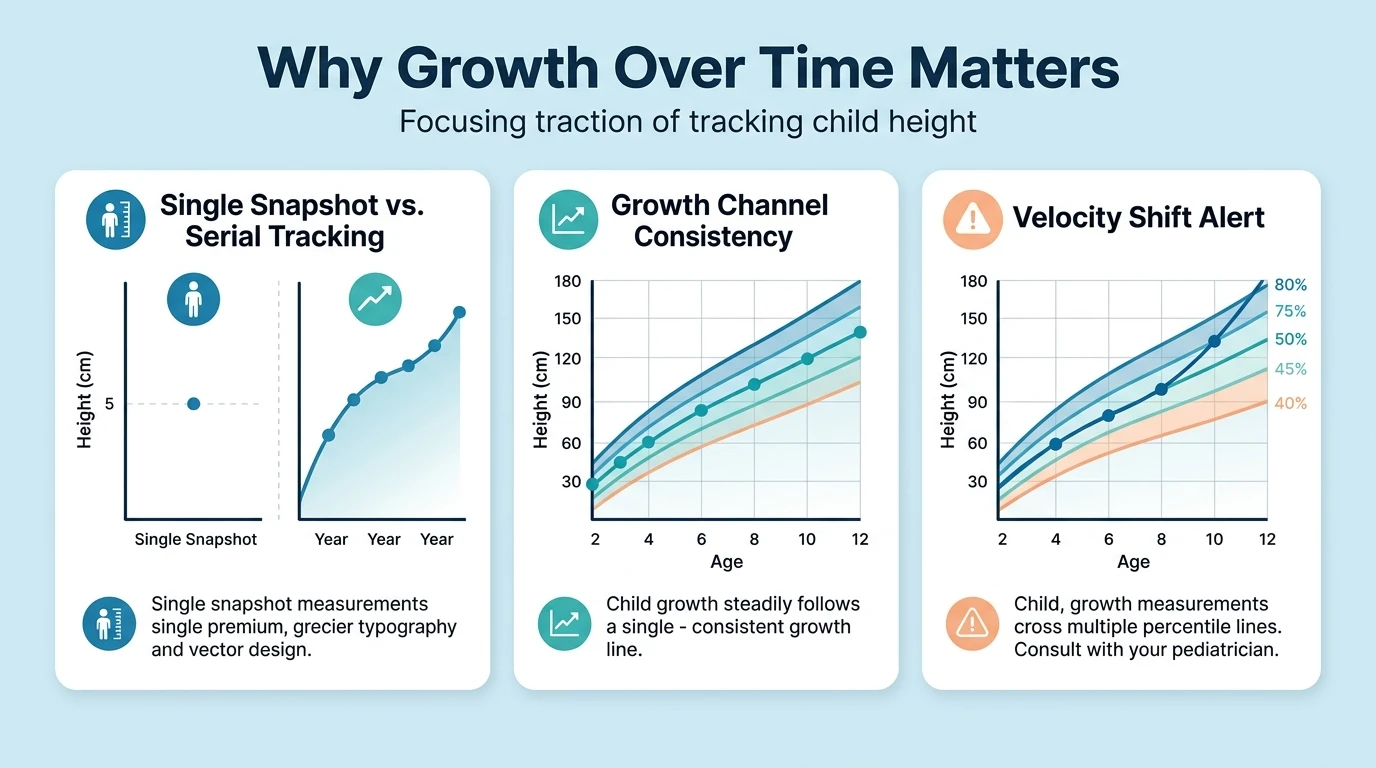
Key trajectory concepts include:
- Growth Curve Tracking: A healthy child typically maintains a consistent percentile curve (for example, staying between the 40th and 50th percentile over multiple years).
- Velocity Shifts: Sudden, unexplained drops across multiple major percentile lines (e.g., falling from the 75th percentile down to the 10th percentile over a short period) warrant professional evaluation.
- Measurement Consistency: Repeated accurate measurements eliminate single-instance measuring errors.
To track children's ongoing growth patterns, use our Child Height Percentile Calculator.
Height Growth Charts
A growth chart is a visual representation of statistical percentile curves plotted against age. The horizontal axis (X-axis) displays age in months or years, while the vertical axis (Y-axis) displays stature or length in centimeters or inches.
Curved percentile lines (typically representing the 3rd, 10th, 25th, 50th, 75th, 90th, and 97th percentiles) allow parents and healthcare providers to visually plot measurements and track growth progression visually over time.
Explore the Height Percentile Chart to view complete pediatric percentile curves.
Which Growth Reference Does the Calculator Use?
Transparency regarding underlying reference data is critical for trustworthy percentile calculations. Our calculator utilizes two universally recognized, official growth reference standards depending on age:
| Reference Standard | Applicable Age Range | Publishing Organization | Methodology & Population Basis |
|---|---|---|---|
| WHO Child Growth Standards | 0 to 24 months (0–2 years) | World Health Organization (WHO) | International Multicentre Growth Reference Study describing optimal growth under healthy conditions. |
| CDC 2000 Growth Charts | 24 to 240 months (2–20 years) | Centers for Disease Control and Prevention (CDC) | United States national population health surveys (NHANES) representing descriptive growth patterns. |
Results calculated for children under 2 years utilize WHO standards, while results for ages 2 to 20 utilize CDC standards. Mixing datasets without clear demarcation leads to inaccurate percentile scores.
You can access the official original resource documentation directly:
- WHO Child Growth Standards — Official World Health Organization length/height-for-age standards (ages 0 to 2 years).
- CDC Growth Charts — Official Centers for Disease Control and Prevention stature-for-age clinical charts (ages 2 to 20 years).
Data Source Disclaimer
Reference data and calculation methods are provided for educational comparison. Results may vary depending on the selected growth standard, measurement accuracy, age precision, and reference population.
How to Measure Height Accurately
Accurate input data is essential for reliable height percentile calculations. Measurement errors of even a single centimeter can alter percentile placement.
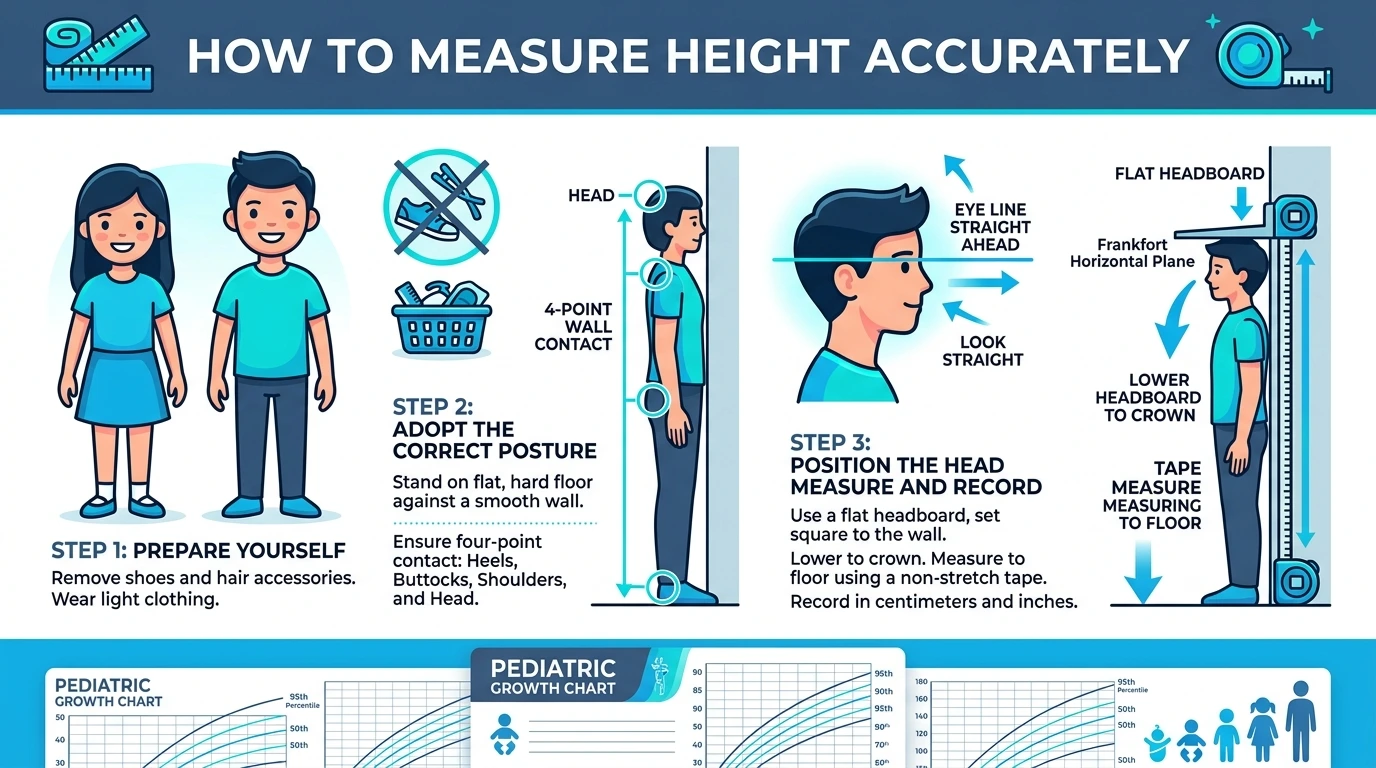
Follow these standard guidelines for measuring stature accurately at home:
- Remove Footwear & Headwear: Have the person remove shoes, heavy socks, and hair accessories.
- Stand on a Hard, Flat Surface: Avoid carpets or uneven flooring; stand against a flat wall.
- Position the Body Correctly: Stand upright with feet flat together. Heels, buttocks, shoulder blades, and back of head should contact the flat wall surface.
- Maintain the Frankfort Plane: Look straight ahead so the line of sight is parallel to the floor.
- Use a Flat Headpiece: Place a flat object (like a rigid book or square box) flat against the head at a 90-degree angle to the wall.
- Mark and Measure Carefully: Mark the wall lightly at the headpiece base and measure from the floor in centimeters or inches using a metal measuring tape.
Height Units: Centimeters, Feet and Inches
Our calculator supports both metric (centimeters) and imperial (feet and inches) measurement units. Height measurements are internally converted into total centimeters before calculating LMS Z-scores.
Centimeters = Total Inches × 2.54
Total Inches = Centimeters / 2.54
Centimeters from Feet & Inches = (Feet × 30.48) + (Inches × 2.54)
Use our dedicated Height Conversion Calculator for quick standing unit conversions.
Can Height Percentile Predict Adult Height?
A child's current height percentile offers a helpful baseline, but it does not guarantee a specific final adult height. Final adult stature is influenced by genetic potential, pubertal timing, nutrition, and general health.
Common height prediction methods include:
- Mid-Parental Target Height Formula: Estimates genetic height potential using biological parents' heights.
- Percentile Maintenance Projection: Assumes a child will remain on their current percentile curve through adulthood.
Try our Height Prediction Calculator for estimated adult stature calculations.
Height Percentiles for Adults
Pediatric growth references (WHO and CDC) end at age 20. Adult height distributions are evaluated using mature adult population health survey data (such as NCHS adult stature studies).
Adult height percentiles compare an adult's static height against adult men or adult women of the same demographic group. To check adult percentile placement, visit our Adult Height Percentile Calculator.
Height Comparison
Height comparison can involve different types of analyses:
- Comparison against population reference data: Computing a height percentile rank for age and sex.
- Direct side-by-side comparison: Comparing the stature of two individuals visually or numerically.
- Comparison against population medians: Calculating difference from the 50th percentile median.
Explore our visual Height Comparison Calculator to compare two heights directly.
What a Height Percentile Does Not Tell You
Understanding the limits of statistical metrics ensures responsible use. A height percentile does NOT:
- Provide a medical or clinical diagnosis of health or disease.
- Measure physical strength, athletic potential, or cognitive ability.
- Guarantee exact future adult height.
- Indicate nutritional sufficiency on its own without continuous growth velocity context.
- Replace comprehensive evaluation by a qualified pediatric medical professional.
When Should Growth Concerns Be Discussed With a Healthcare Professional?
Parents or caregivers who have questions regarding a child's growth pattern may wish to consult a qualified healthcare professional. Topics for discussion might include:
- A continuous drop or jump across multiple major percentile curves over successive measurements.
- Height measurement consistently remaining below the 3rd percentile or above the 97th percentile alongside other symptoms or developmental concerns.
- Growth stagnation where linear height increases very little over a prolonged period during childhood.
- Questions regarding pubertal timing, early development, or delayed growth spurts.
Height Percentile Calculator Limitations
While mathematically precise relative to source datasets, statistical calculators have inherent limitations:
- Reference Population Bias: Growth reference datasets reflect specific reference populations, which may not capture all global ethnic variations perfectly.
- Measurement Precision Limits: Minor measuring technique errors affect percentile outputs.
- Age Rounding Effects: Precision depends on accurate input of age in months.
- Mathematical Interpolation: Ages between dataset reference points utilize linear parameter interpolation.
Height Percentile Calculation Example
To illustrate how the calculator evaluates input parameters against production datasets, consider the following step-by-step example calculation:
Age: 10 Years (120 Total Months) • Biological Sex: Male • Height: 140.0 cm
L = 1.12 (skewness) • M = 142.50 cm (median) • S = 0.0474 (variation)
Z = [(140.0 / 142.50)1.12 - 1] / (1.12 × 0.0474)
= [(0.98246)1.12 - 1] / 0.053088
= -0.01961 / 0.053088 = -0.3693
CDF(-0.3693) = 0.3559 → 35.6th Percentile
Interpretation: A 10-year-old male measuring 140.0 cm falls around the 35.6th percentile, meaning height is equal to or greater than ~35.6% of reference peers.
Frequently Asked Questions About Height Percentiles
A height percentile is a statistical measure indicating how an individual's height compares with a standardized reference population of the same age and biological sex.
The calculator converts height into centimeters, matches age in total months and biological sex to reference datasets, computes an LMS Z-score, and transforms that score into an exact percentile rank using standard normal CDF probabilities.
Height percentile by age compares measured height against age-matched population reference datasets (WHO standards for 0-2 years, CDC charts for 2-20 years) using LMS parameters for skewness, median, and variation.
The 50th percentile represents the statistical median height of the reference population. Half of individuals of the same age and sex are taller than this height, and half are shorter.
The 25th height percentile indicates that measured height is equal to or greater than approximately 25% of individuals in the reference population of the same age and sex, while 75% are taller.
The 75th height percentile means measured height is equal to or greater than approximately 75% of the reference population for that age and sex, while 25% are taller.
The 90th height percentile indicates relative height positioning where an individual is taller than roughly 90% of peers in the reference dataset.
The 10th percentile means height is near the lower portion of the reference spectrum, taller than about 10% of the reference population of the same age and sex.
No. Percentile scores describe comparative statistical position, not clinical health. Healthy individuals naturally exist across the entire spectrum, including lower percentiles.
No. A high percentile simply indicates a taller relative position compared to reference peers and does not signify a medical issue by itself.
Yes. A child's growth percentile can fluctuate due to growth spurts, puberty timing, illness, nutritional changes, or normal developmental variance.
The average height for any age corresponds to the 50th percentile median height established by reference standards such as WHO (0-2 years) or CDC (2-20 years).
Yes. Biological males and females follow distinct biological growth trajectories, so separate male and female reference tables are evaluated.
Height percentile provides a useful reference marker, but adult height predictions require considering mid-parental genetic heights, growth trajectories, and pubertal timing.
For infants and toddlers aged 0 to 24 months, the WHO Child Growth Standards are recommended. For children and adolescents aged 2 to 20 years, the CDC Growth Reference Charts are used.
Average height (median) is a single central reference point, whereas a height percentile expresses an individual's relative rank across the complete statistical distribution curve.
Calculators are mathematically precise relative to the underlying WHO or CDC reference datasets, assuming input age, sex, and measurement accuracy.
Yes. Adults are evaluated against mature adult height distribution datasets (such as NCHS adult surveys) rather than pediatric growth curves.
Either unit is fine. The calculator converts feet and inches into centimeters for calculation, so both produce identical statistical percentile results.
Different calculators may use different reference standards (WHO vs CDC), different dataset smoothing techniques, or different age rounding methods.