

How to Read and Interpret Height Percentile Charts
Height percentile charts provide a standardized, population-based benchmark for evaluating human growth over time. A height percentile rank indicates the proportion of individuals of the exact same age and biological sex who measure shorter than a given height.
For example, if a 10-year-old child's height plots at the 75th percentile, it means:
- 75% of children of the same age and sex in the reference population are shorter.
- 25% of children of the same age and sex are taller.
- The child is taller than the population median (50th percentile) for their age cohort.
Pediatricians and growth specialists emphasize that growth velocity and consistency over time are far more informative than any single isolated percentile reading. Most healthy children follow a steady trajectory along or parallel to a specific percentile curve as they grow.
Understanding Height Percentile Ranges
Height percentiles on official CDC and WHO charts are organized into standardized statistical bands. Below is an overview of how percentiles correspond to relative population positioning:
| Percentile Band | Statistical Position | Interpretation & Context |
|---|---|---|
| Below 3rd Percentile | Lower Reference Boundary | Shorter than 97% of peers. May warrant medical review to rule out endocrine or metabolic factors. |
| 3rd – 10th Percentile | Lower Standard Range | Shorter than average, but typically within normal genetic variation if growth rate is steady. |
| 10th – 25th Percentile | Below-Median Standard Range | Consistently within the lower quarter of population distribution; healthy normal growth. |
| 25th – 75th Percentile | Core Population Average | Represents the central 50% of the population centered around the 50th percentile median. |
| 75th – 90th Percentile | Above-Median Standard Range | Taller than average; falling within the upper quarter of standard reference distribution. |
| 90th – 97th Percentile | Upper Standard Range | Taller than 90% to 97% of reference peers; expected with tall parental genetic background. |
| Above 97th Percentile | Upper Reference Boundary | Taller than 97% of peers. Commonly associated with tall parents or early growth acceleration. |
WHO vs. CDC Height Percentile Chart Standards
Height growth charts rely on two internationally recognized reference standards depending on age:
- WHO Child Growth Standards (0 to 24 Months): Established by the World Health Organization based on the Multicentre Growth Reference Study. They depict how children should grow under optimal physiological conditions, including exclusive breastfeeding and ideal living environments. Measurements are taken as recumbent length (lying down).
- CDC 2000 Growth Charts (2 to 20 Years): Developed by the US National Center for Health Statistics (NCHS) and CDC. They represent a descriptive baseline of how American children grew during national health examination surveys. Measurements are taken as standing stature (upright).

Methodology Tip: Length vs. Stature
Recumbent length (measured lying down for children under 2) is slightly greater than standing stature (measured upright). Our height percentile calculator automatically accounts for these standard methodological transitions at 24 months.
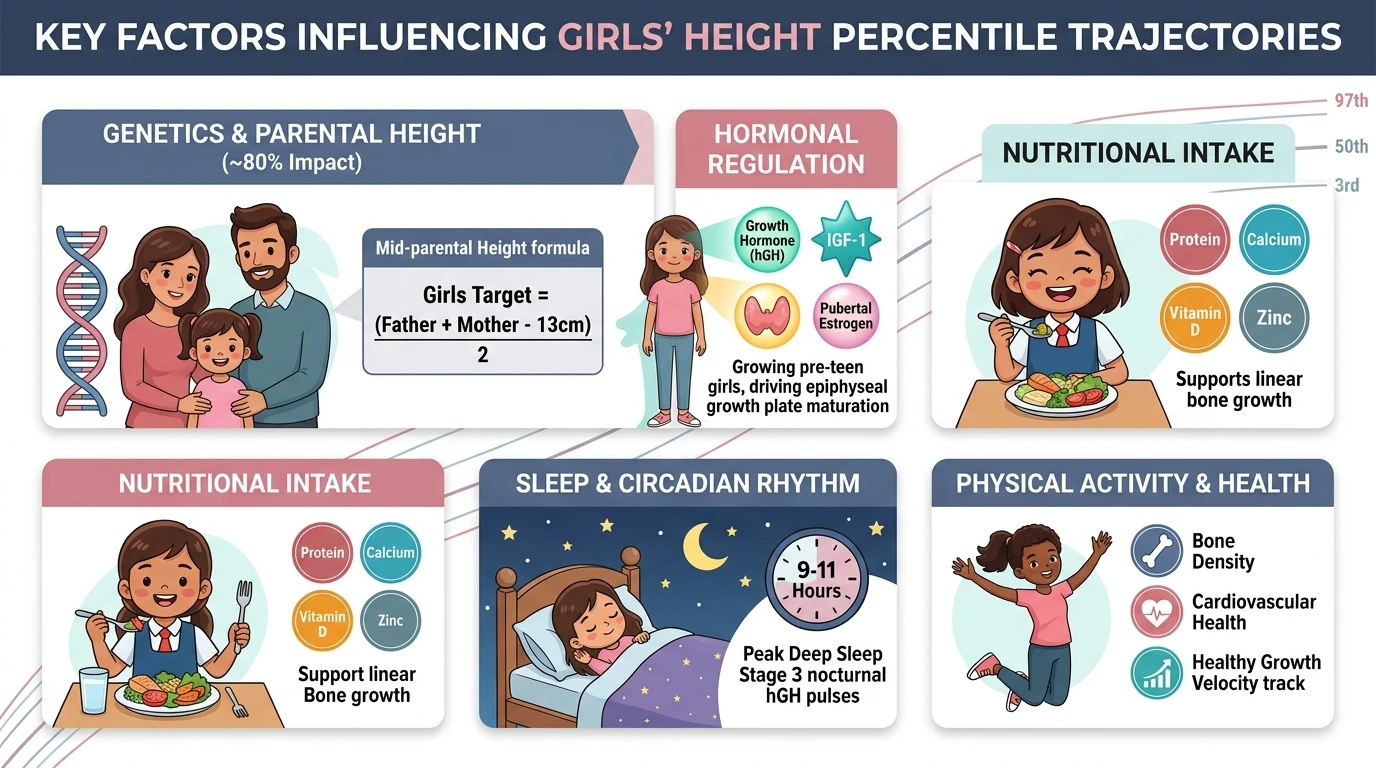
Key Factors Influencing Height Percentile Trajectories
A child's height percentile is governed by a combination of biological, genetic, and environmental determinants:
- Genetics & Parental Height: Genetics accounts for approximately 80% of final adult stature variance. Target height can be estimated using the Mid-Parental Height formula.
- Hormonal Regulation: Human Growth Hormone (hGH) secreted by the pituitary gland, Insulin-like Growth Factor 1 (IGF-1), thyroid hormones, and sex steroids during puberty drive skeletal maturation.
- Nutritional Intake: Adequate protein, calcium, vitamin D, zinc, and overall caloric intake are necessary to support bone mineral density and linear growth.
- Sleep & Circadian Rhythm: Pulsatile growth hormone release reaches its peak during deep slow-wave stage 3 sleep.
- General Health & Physical Activity: Regular physical activity and freedom from chronic inflammatory or gastrointestinal conditions foster optimal growth.
Girls Target Height (cm) = [ Father's Height + Mother's Height - 13 cm ] / 2
Growth Velocity & Pubertal Growth Spurts
Growth rate (velocity) is the change in standing height over a defined time period (typically cm per year). Growth velocity changes significantly across different developmental stages:
- Infant Growth Phase (Birth to 12 Months): Rapid linear growth velocity averaging ~25 cm (10 inches) in the first year.
- Childhood Steady Phase (Ages 2 to 10): Stable growth rate averaging 5 to 6 cm (2 to 2.5 inches) per year.
- Pubertal Peak Height Velocity (PHV): The maximum growth velocity during adolescent growth spurts. Girls typically reach PHV between ages 11 and 12 (~8–10 cm/yr), while boys reach PHV between ages 13 and 14 (~10–12 cm/yr).

Because children experience growth spurts at different physiological ages (early maturators vs. late maturators), temporary crossing of percentile lines often occurs during early adolescence before leveling out near mid-parental height target ranges.
Evaluating Growth Trajectory Deviations
While tracking along a consistent percentile line indicates healthy linear growth, certain patterns may warrant evaluation by a pediatrician or pediatric endocrinologist:
- Percentile Line Crossing: A sustained shift upward or downward across two or more major percentile channels (e.g., dropping from the 50th percentile to the 10th percentile over 6–12 months).
- Extreme Percentile Standing: Standing height consistently below the 3rd percentile or above the 97th percentile without corresponding parental tall or short stature.
- Mid-Parental Target Discrepancy: Height percentile that diverges significantly (more than 2 standard deviations) from expected mid-parental height calculations.
Clinical Distinctions: Familial vs. Delayed Growth
Familial Short Stature: Healthy children with short parents who consistently track along a lower percentile (e.g., 5th percentile) with normal bone age.
Constitutional Delay ("Late Bloomers"): Children who grow below the average percentile during childhood, experience delayed puberty, but continue growing longer into late adolescence to reach normal adult height.
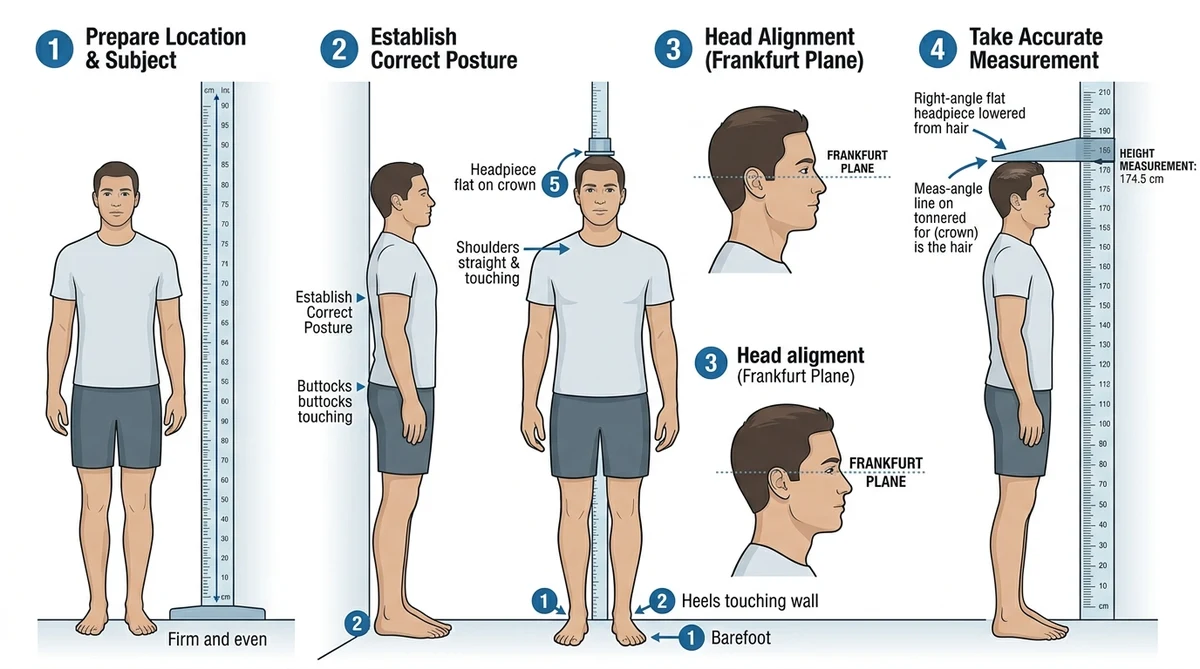
How to Accurately Measure Height for Charting
To accurately plot height on reference charts, consistent and precise measurement technique is required:
- Remove Footwear & Hair Accessories: Measure in bare feet or thin socks with flat hair.
- Stand Against a Flat Vertical Surface: Have the person stand against a hard wall without baseboards if possible.
- Check Body Alignment: Heels, buttocks, shoulder blades, and back of the head should touch the vertical wall surface.
- Position Head in the Frankfurt Plane: Ensure the line of sight is straight ahead so the line from the lower eye socket to the ear canal is horizontal.
- Use a Flat Right-Angle Headpiece: Place a sturdy flat object (like a wooden block or ruler) flat against the wall and lower it to touch the crown of the head.
- Mark & Measure: Lightly mark the wall at the bottom edge of the block and measure from the floor in centimeters or inches.
Frequently Asked Questions About Height Percentile Charts
Any height percentile between the 3rd percentile and 97th percentile is statistically considered within the normal reference range for healthy individuals. The 50th percentile represents the median height of the reference population.
You can determine your exact height percentile by entering your age, biological sex, and standing height into our online height percentile calculator, or by cross-referencing your height against WHO (0–2 years) or CDC (2–20 years) percentile lookup tables.
Being in the 90th percentile for height means you are taller than 90% of individuals of the same age and biological sex in the reference population, with only 10% being taller. For adult US men, the 90th percentile is approximately 6'1" (185 cm); for adult US women, it is approximately 5'7.5" (171 cm).
Being in the 25th percentile for height means your height is greater than 25% of peers of the same age and sex, while 75% are taller. For adult US men, the 25th percentile is approximately 5'8" (173 cm); for adult US women, it is approximately 5'2.5" (159 cm).
The top 1 percentile (99th percentile) represents the tallest 1% of the reference population. For adult US males, the 99th percentile starts at approximately 6'4" (193 cm); for adult US females, it starts at approximately 5'10" (178 cm).
For adult US women, a height of 5'4" (162.5 cm) is right around the 50th percentile (the population median). For adult US men, 5'4" falls at approximately the 3rd to 5th percentile.
Using the Mid-Parental Target Height formula: A boy is estimated to reach approximately 6'0.5" (184 cm ± 5 cm), calculated as [(5'10" + 5'6" + 5") / 2]. A girl is estimated to reach approximately 5'5.5" (171 cm ± 5 cm), calculated as [(5'10" + 5'6" - 5") / 2].
Yes, tracking a child's height percentile trajectory over time is a reliable predictor of adult height, as most healthy children follow a steady growth curve along their established percentile channel until skeletal growth completes.
Linear height growth stops when the epiphyseal growth plates in long bones fuse at the end of puberty. On average, females stop growing around ages 14 to 16, while males stop growing around ages 16 to 18 (with occasional growth continuing up to age 20).